A stateful AI system that tries to predict stock prices (using news)
Using daily news sentiment as a signal for next-day stock price movement
ok so what is this?
I built an app called stocksbrew a while back. It sends me a clean little email every morning with AI summaries of news about the stocks I care about (before the market opens).
Then my brain went: yuh but… does this news stuff actually mean anything?
Like, if the news around a stock is positive today, is the stock more likely to go up tomorrow? And if yes, is it predictive enough to not just be vibes?
In other words, can I use the daily news summaries to predict if the stock will go up or down before the market actually opens?
what i built (the whole pipeline)
First, what data do I even have?
In StocksBrew’s DB, there’s a news_summaries table that stores daily summaries for subscribed stocks. Those summaries are produced by a simple 2-step pipeline:
- fetch raw news (NewsAPI + my custom crawler)
- pass the raw news to an LLM (some version of
gemini-flash) → get a daily summary
Now for this project, I extended that pipeline with sentiment:
- input: today’s summary
- output: a
sentiment_score(numeric, roughly “how bullish/bearish are the updates”)
I could have just told the model “also output sentiment_score” in the same prompt as the summary, but that felt too naive (and probably inconsistent).
So instead I made a historical_context object and passed it along with today’s news so the model has some grounding and can be more consistent day-to-day.
The historical_context object contains mainly three things:
- sentiment_scores of the last 5 days
- news_summaries of the last 5 days
- stock_price movement over the last 5 days
My guess was: giving the model a tiny “memory” should make the sentiment score less random. I didn’t A/B test it against the naive version though, so that’s still a “trust me bro (for now)” assumption.
Once I settled on this, I wrote a script that backfills sentiment scores for recent history (I did ~45 days worth), then used those scores to predict whether price moves up/down the next trading day.
sanity check (does sentiment even move with price?)
Before going full quant-goblin, I did the obvious thing: plot sentiment vs actual movement and see if there’s any relationship.
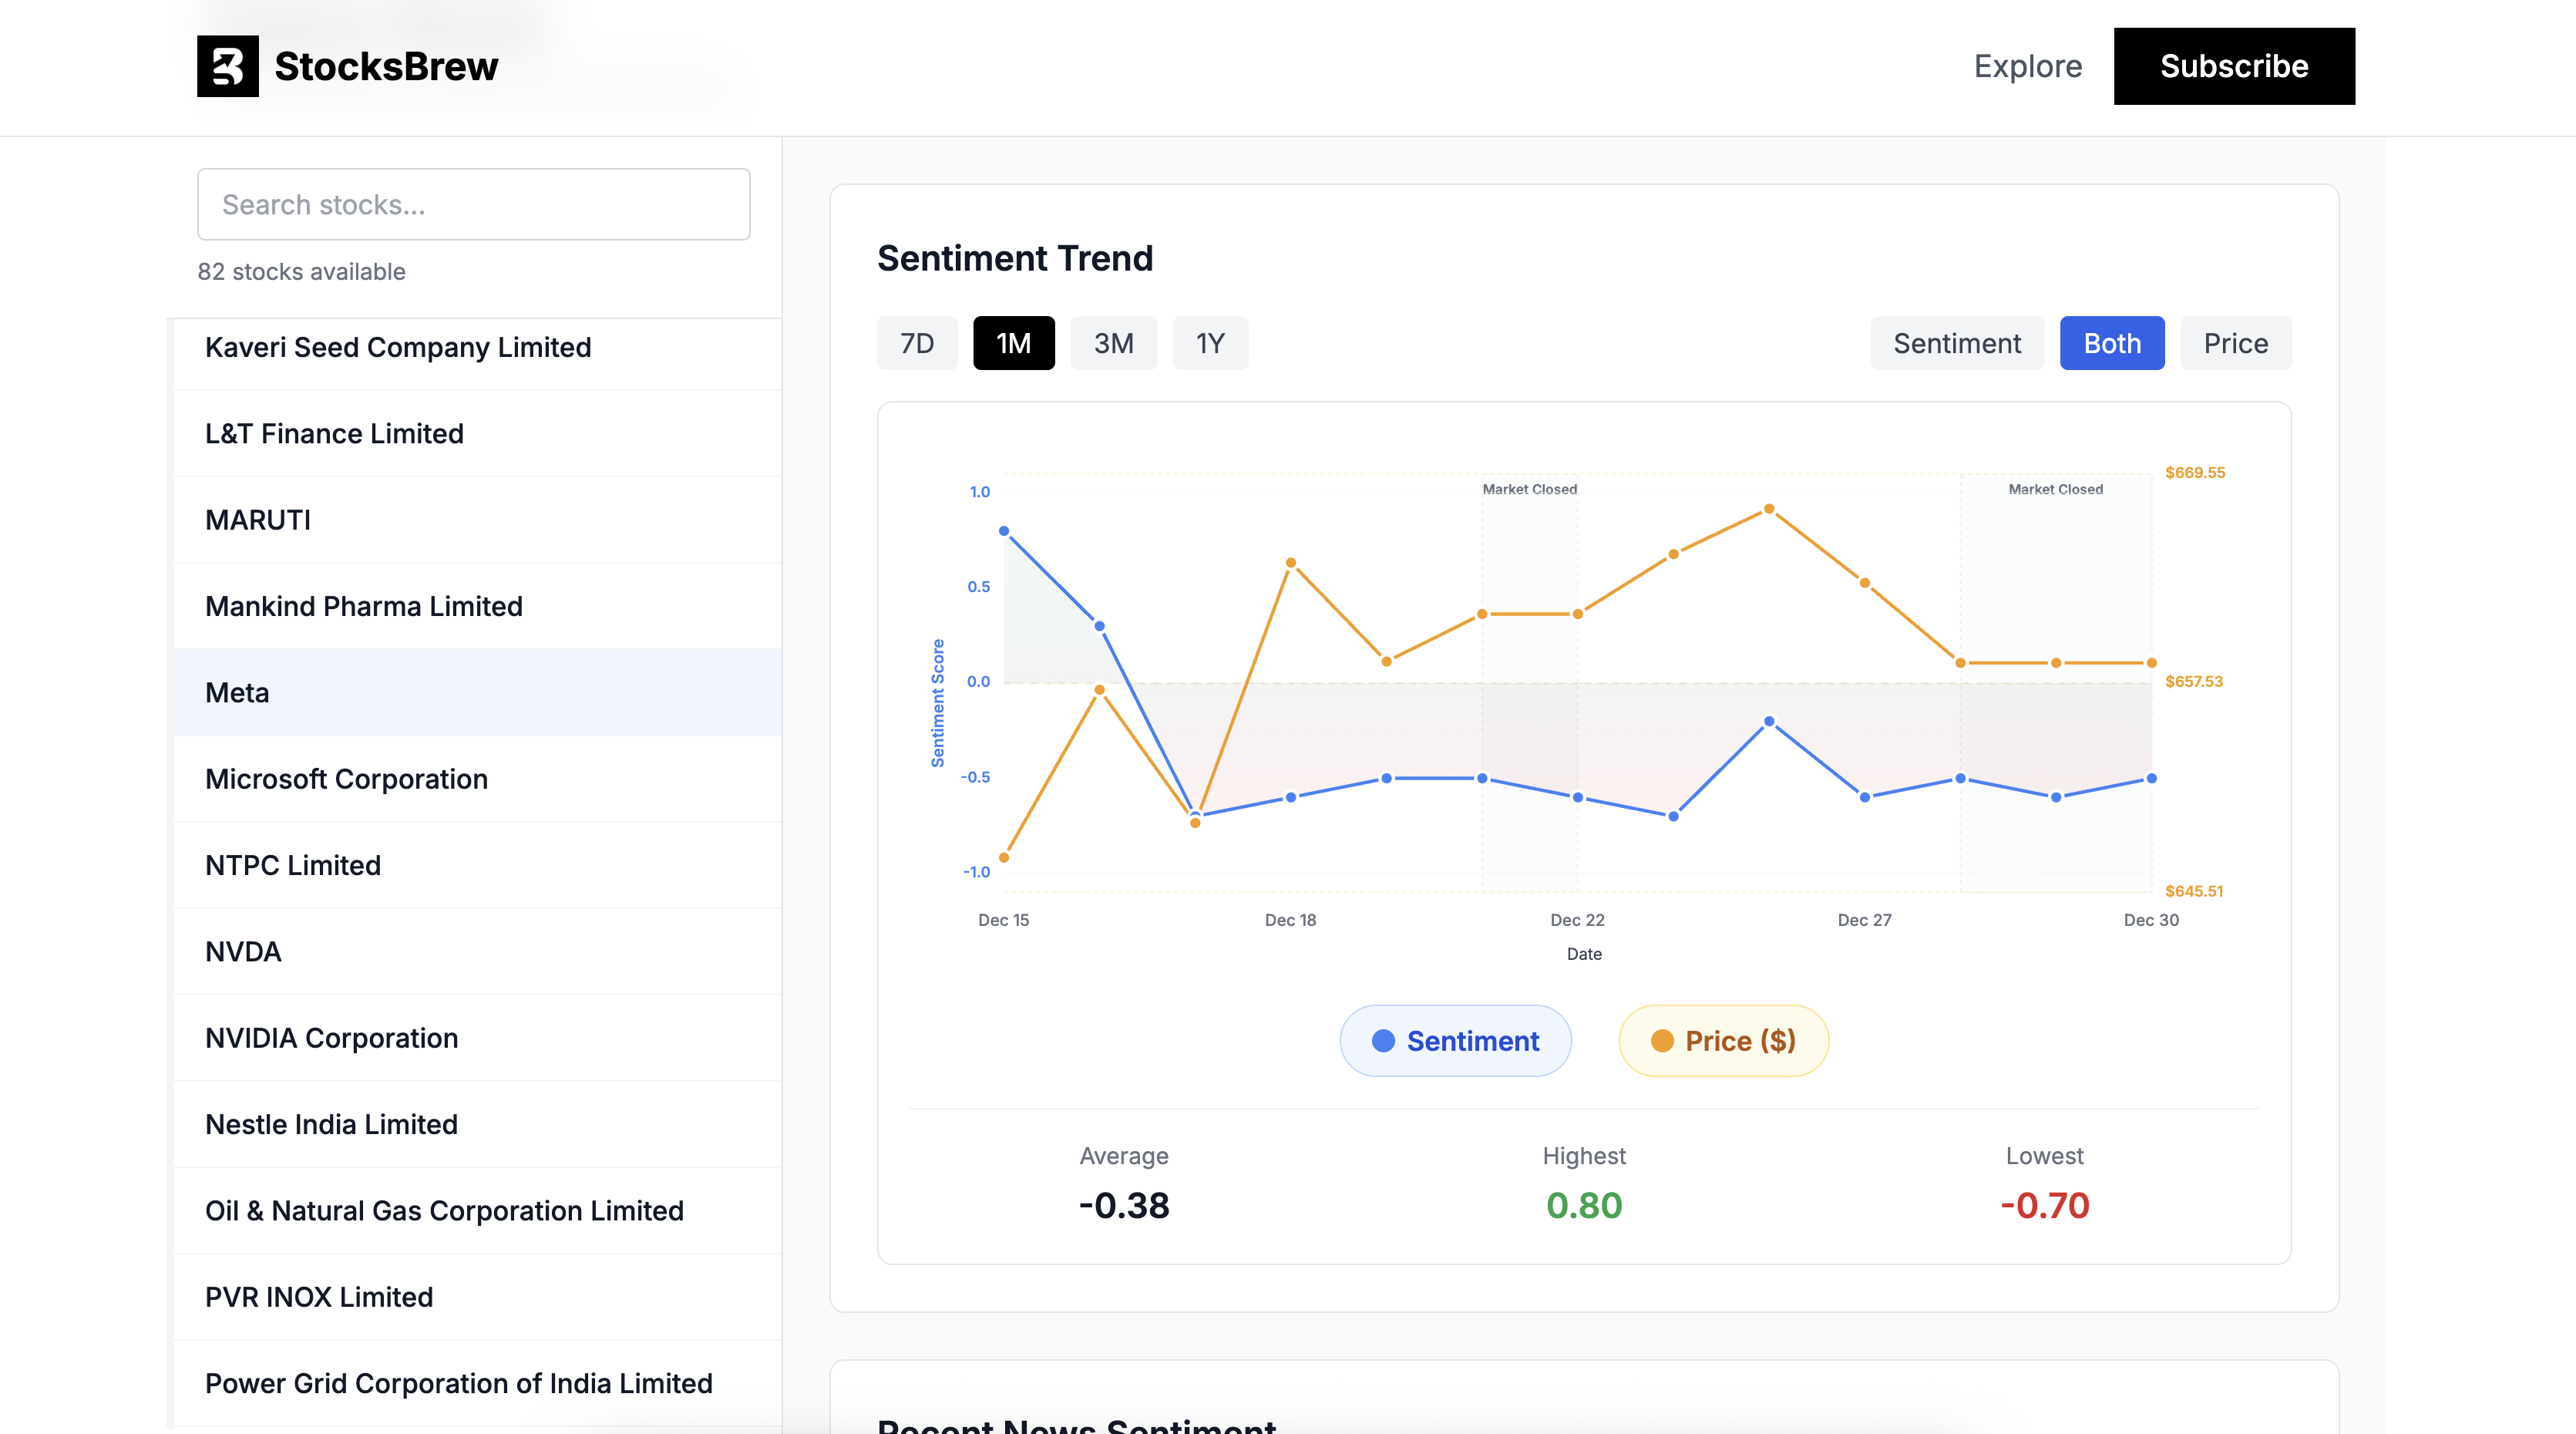
Sometimes it looks aligned. Sometimes it’s completely off. So I needed actual metrics, not just “it kinda looks right sometimes”.
I needed to know answers to things like - how many times did it make the correct predictions, when does it fail, is it better than random guessing?
evaluation (aka “is it better than flipping a coin?”)
So I crunched numbers across different time windows + different ways of turning sentiment into a “prediction”.
Important note / not cheating note:
- I only compute these metrics for stocks that have enough samples (I used >5 predictions in the selected window) so a single lucky/unlucky stock doesn’t dominate.
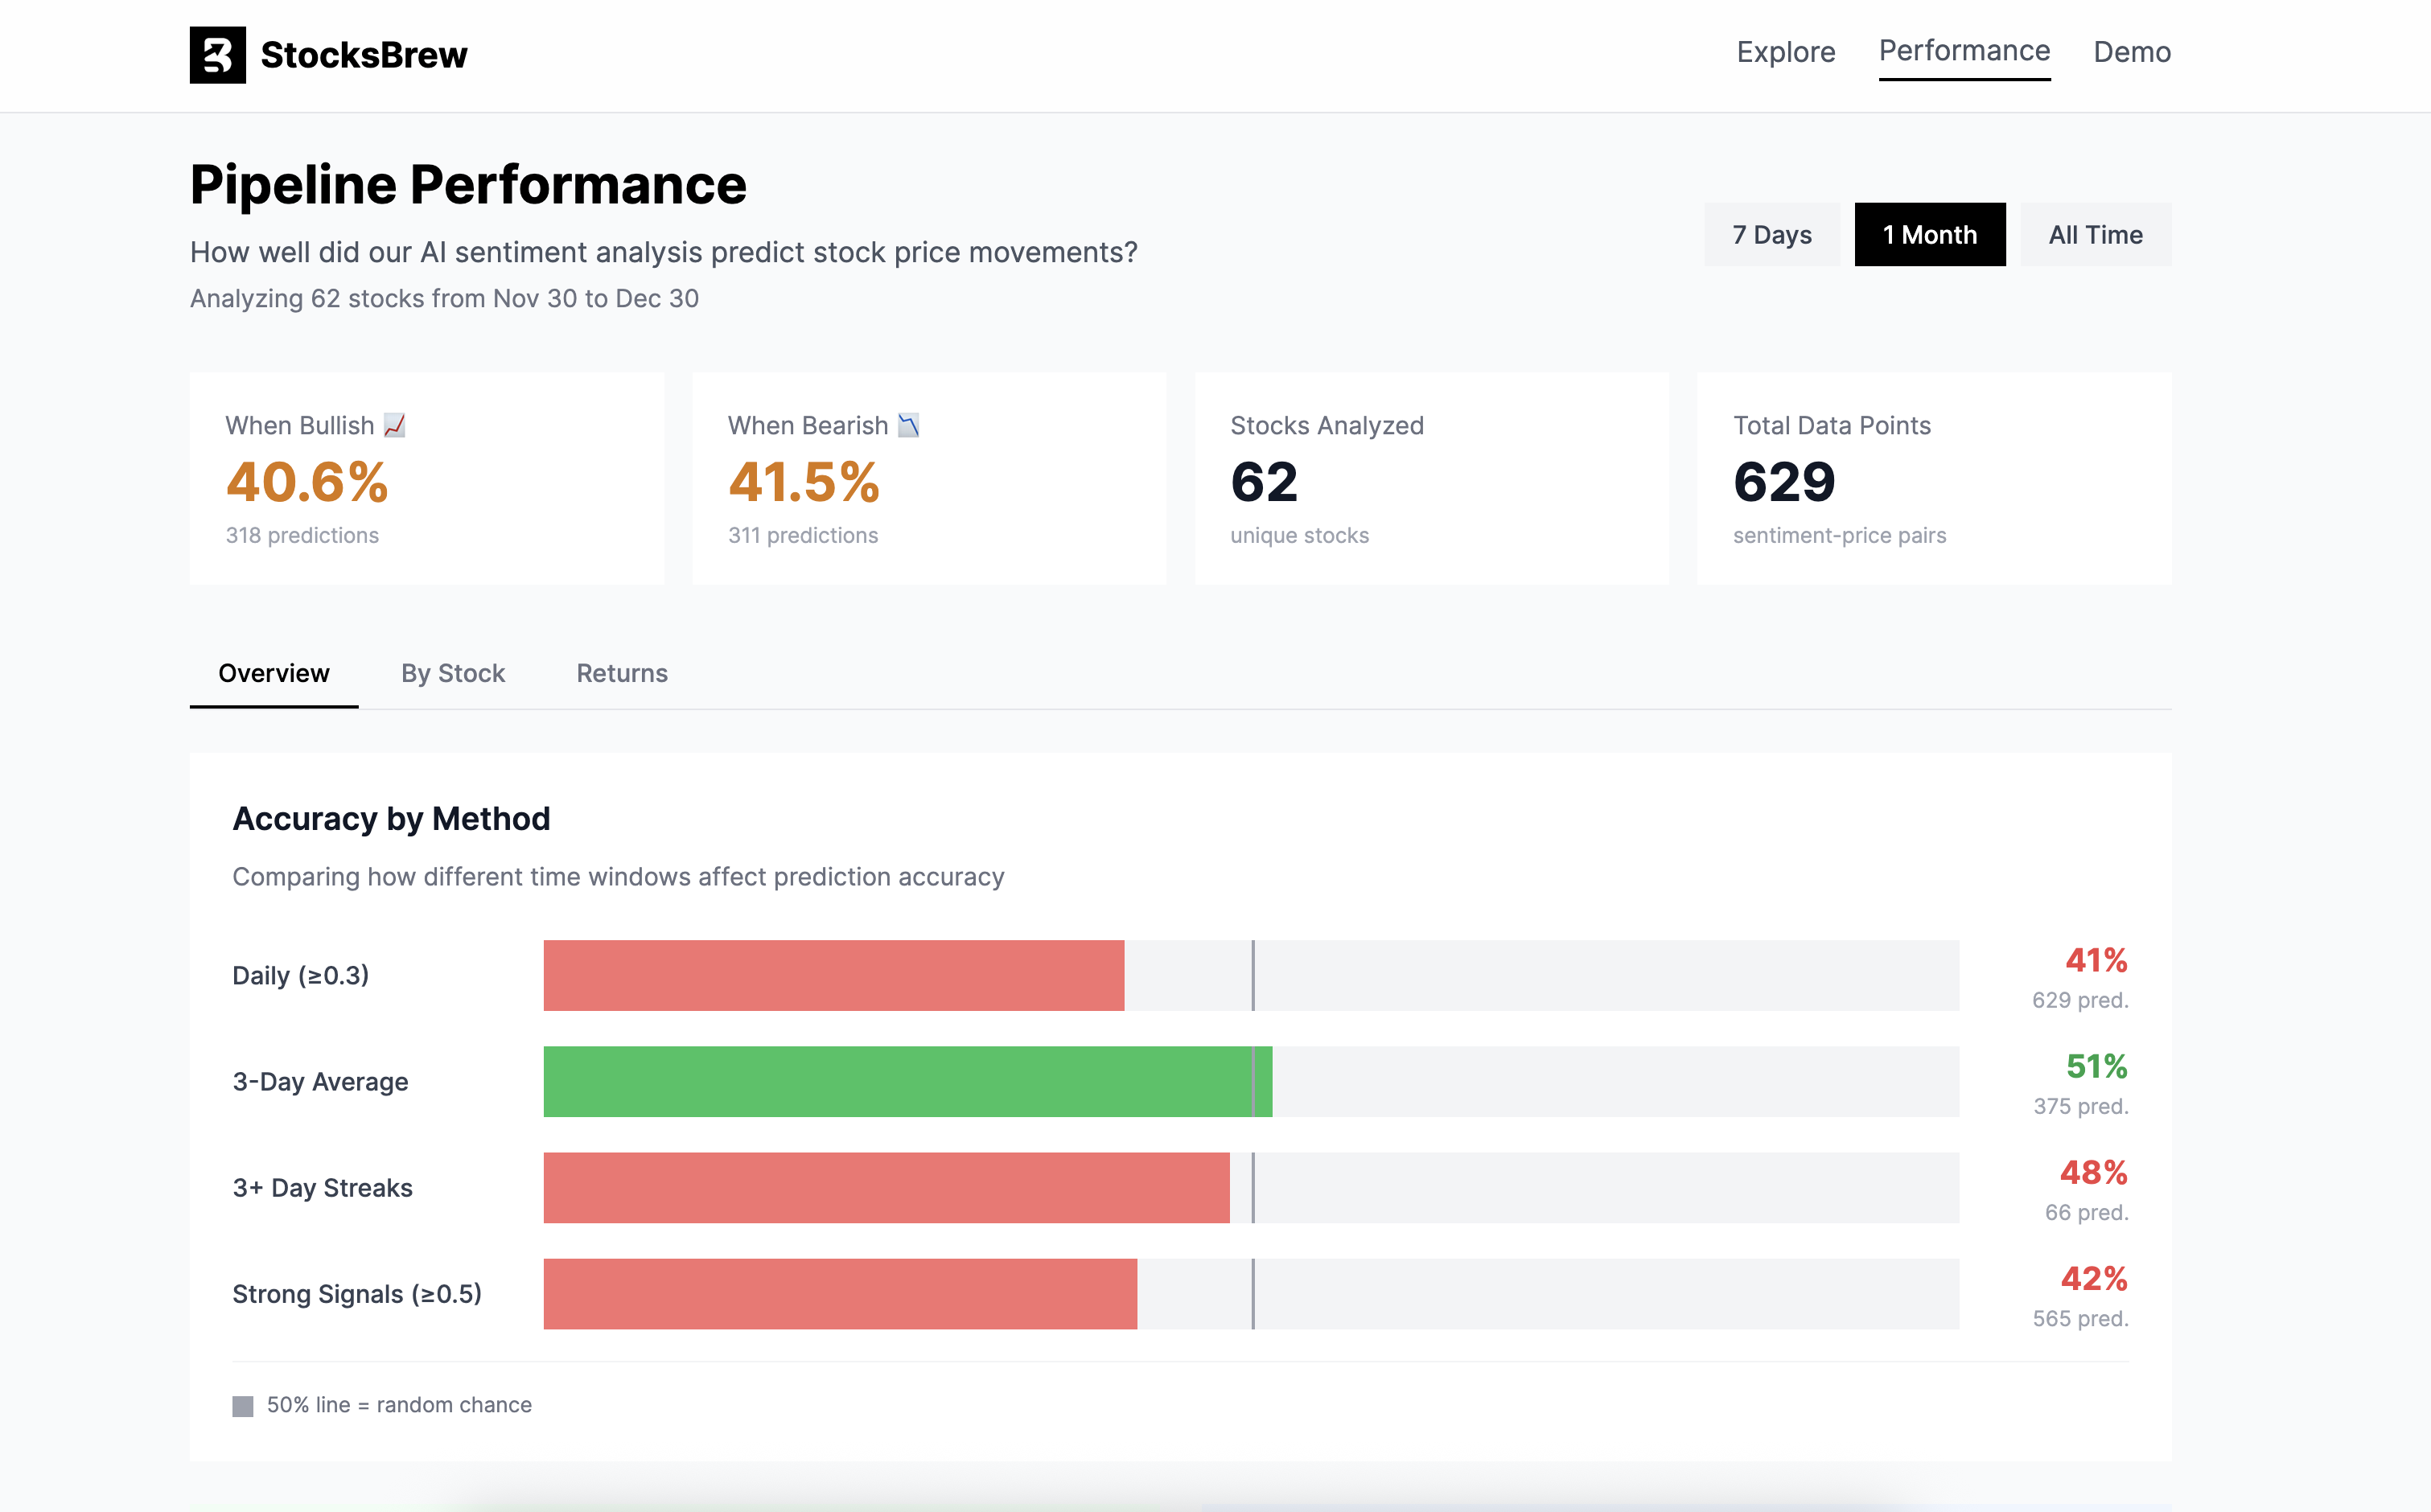
What popped out immediately:
- Daily predictions were not great (worse than random in my tests… rip).
- But when I use a 3-day rolling average (sentiment + movement), it behaves way nicer — around 1% better than random chance (CRY) in the screenshot above.
This makes sense to me because news is noisy. A 3-day average smooths “one weird headline day” and focuses more on sustained sentiment.
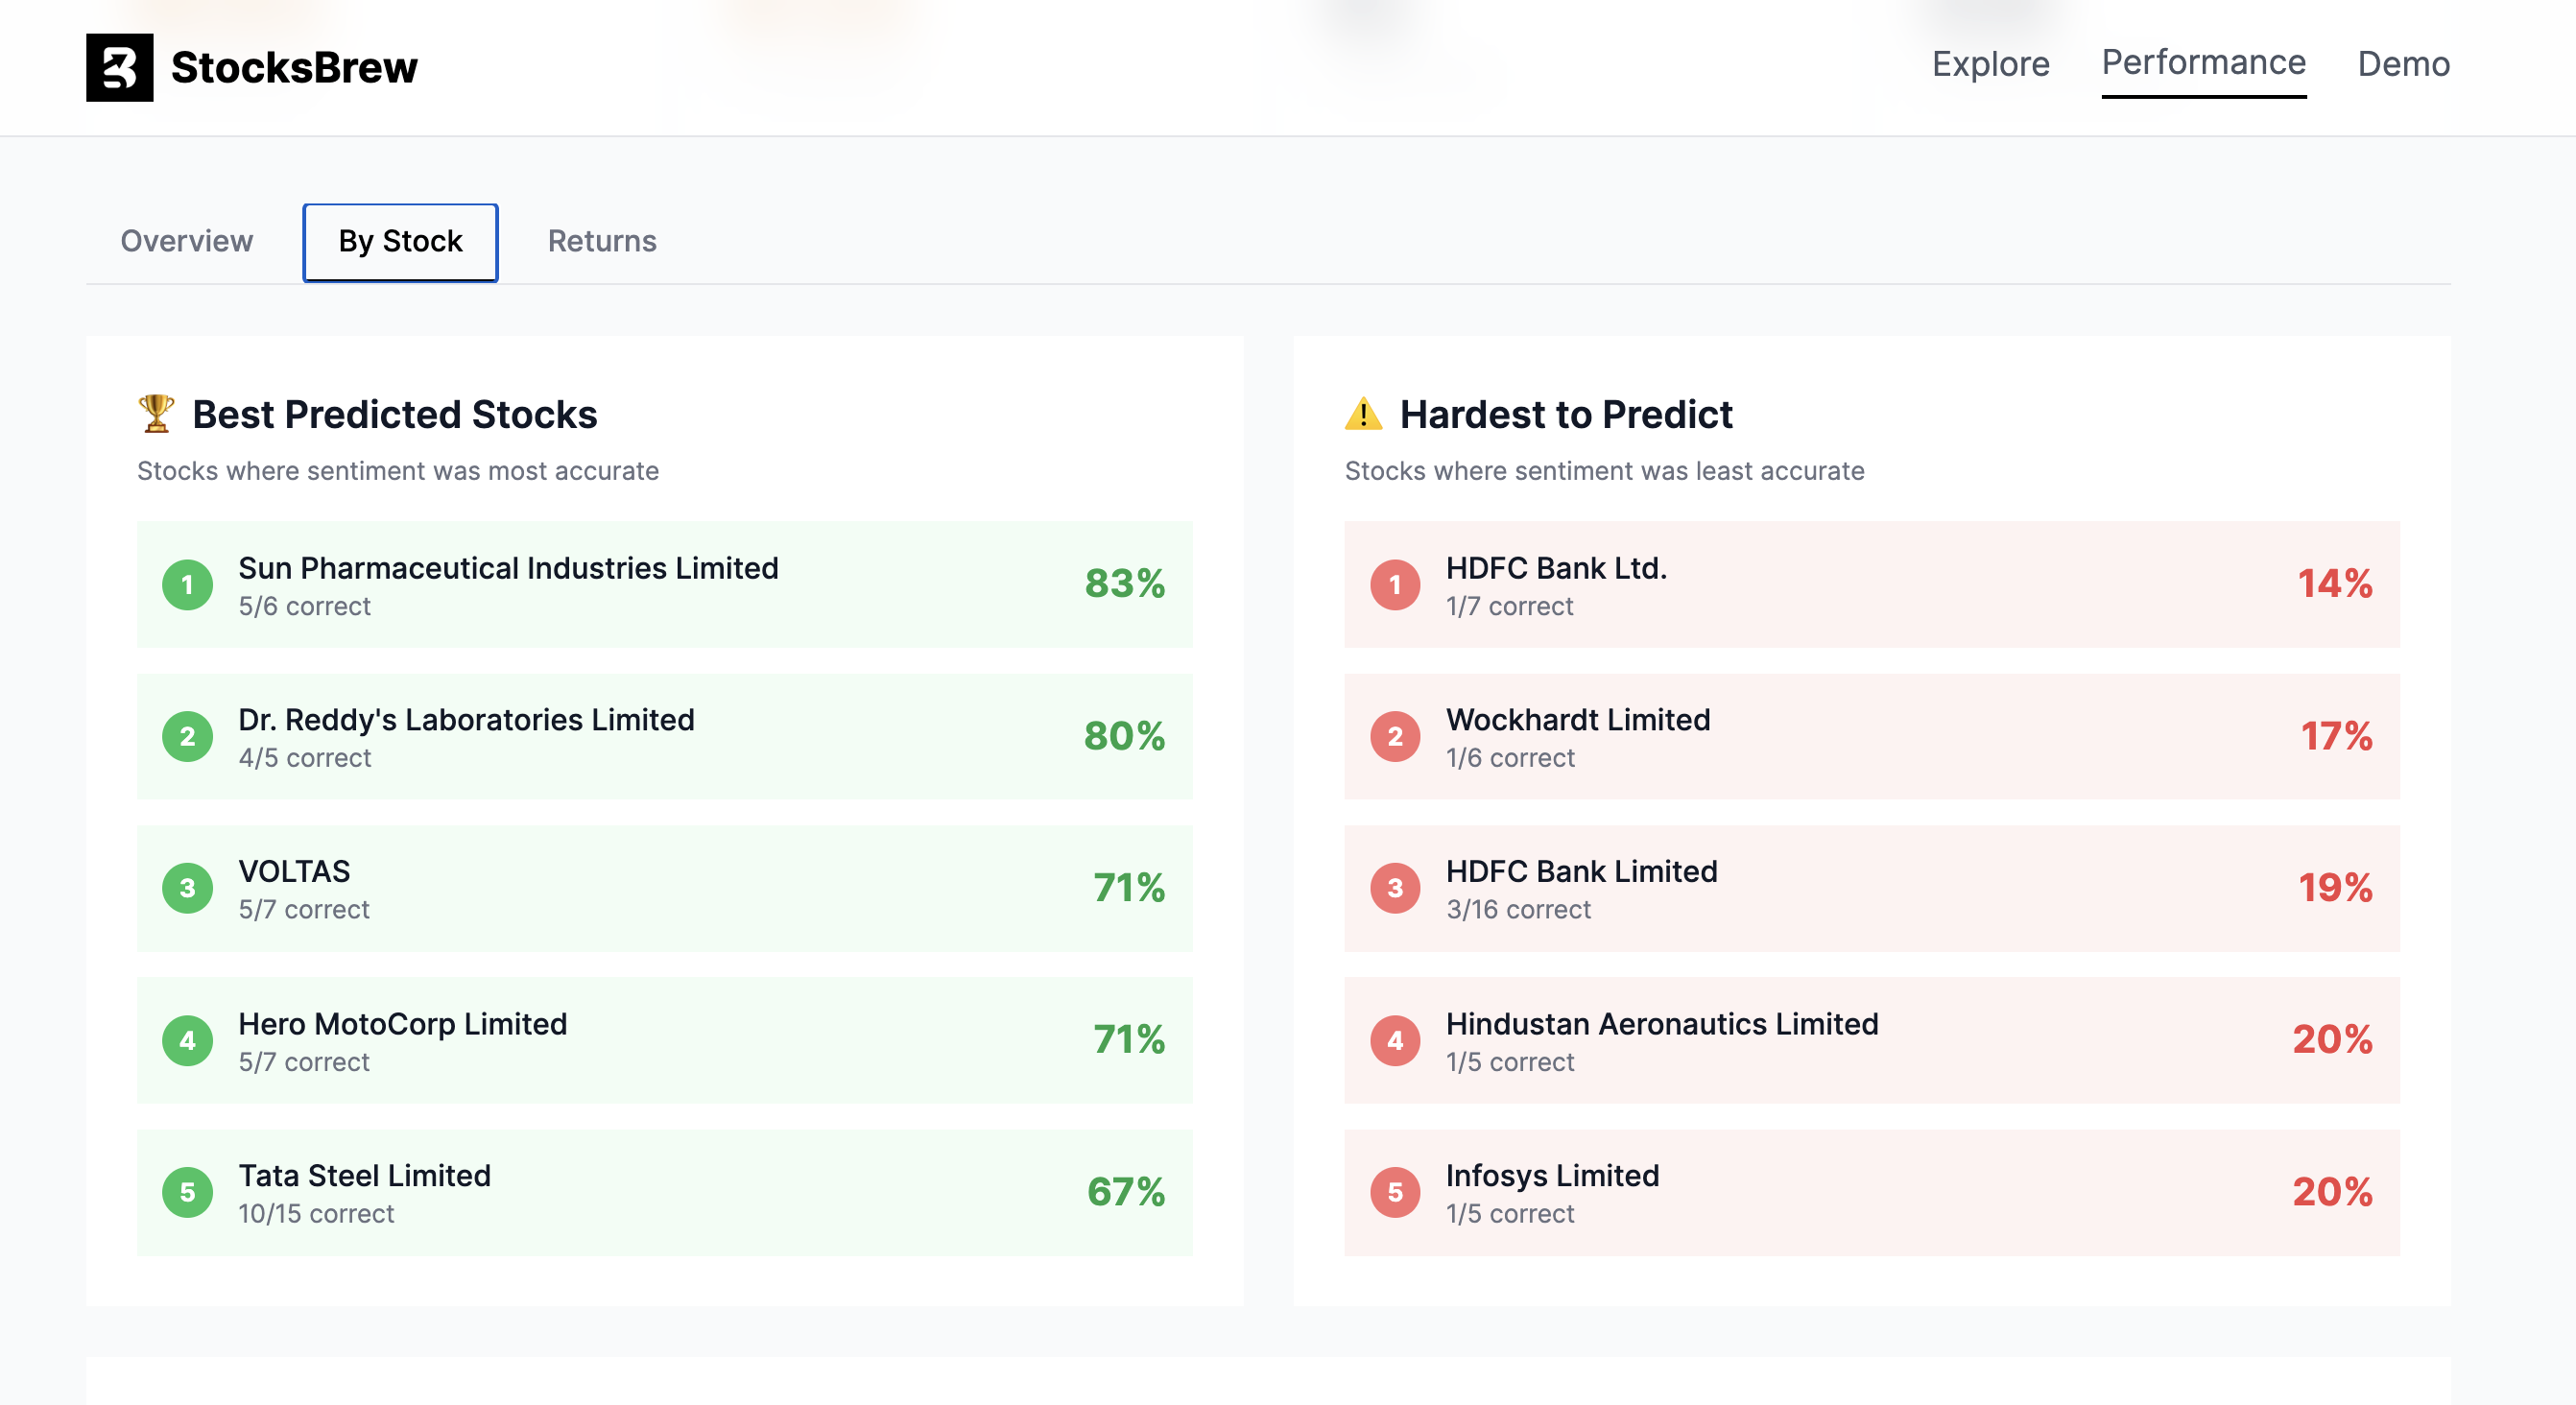
fun metric: which stocks “listen to the news”?
Another thing I really enjoyed: ranking stocks by how often sentiment direction matches the next-day movement.
Basically: “which tickers are news-driven (at least in this dataset)” vs “which tickers just do their own thing”.
returns tab (comparing strategies)
I also built a Returns tab where I can compare different strategies side-by-side.
First, I vary how I generate the signal:
- Daily signals: trade on today’s sentiment (no smoothing)
- 3-day rolling average: smoother signals, less headline-noise
- 5-day rolling average: even smoother, slower to react
Then, I vary what universe I trade:
- All stocks: trade everything (more trades, more chaos)
- High accuracy only: only trade stocks where the model historically crosses >50% accuracy (less trades, hopefully less pain)
Finally, for each combo, I simulate a simple long/short rule:
- LONG when rolling-average sentiment is clearly positive (example threshold I used in the UI: (> 0.3))
- SHORT when rolling-average sentiment is clearly negative (example threshold: (< -0.3))
- otherwise: HOLD
And I track basic outcomes like:
- average return per trade
- cumulative return
- number of trades (because some strategies “look good” just because they barely trade)
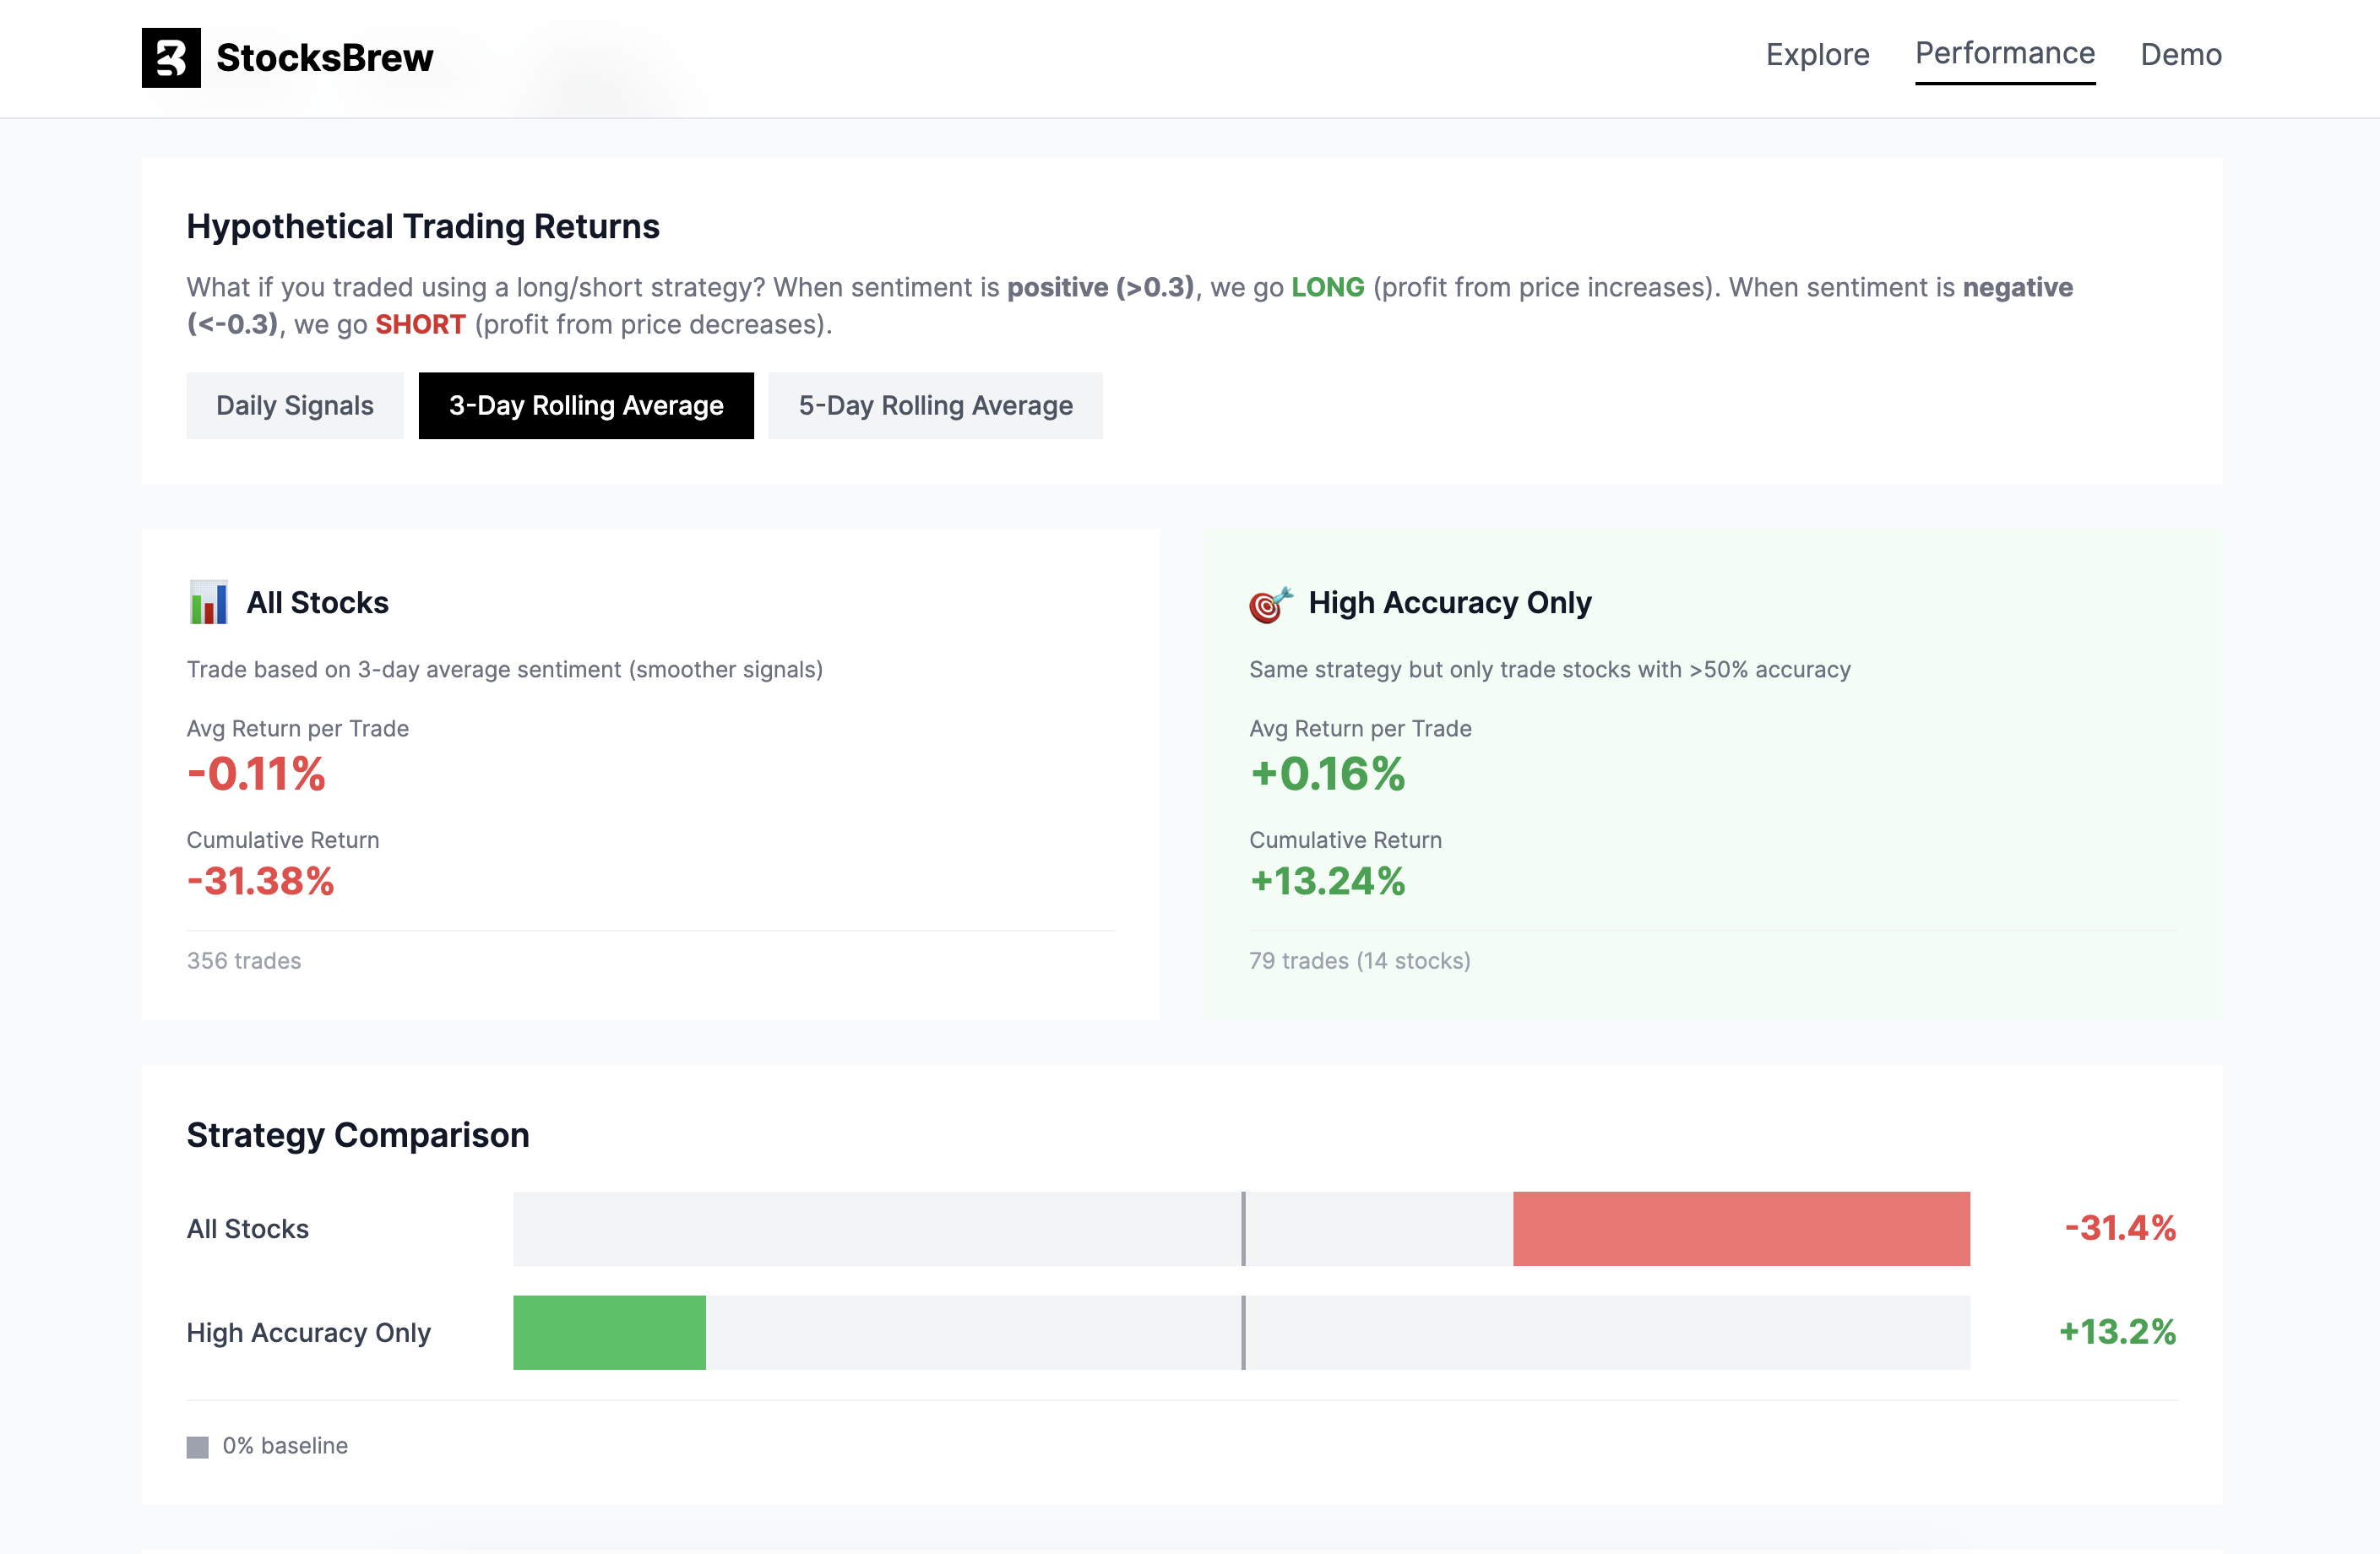
the “ok but would i make money?” part
Now the fun part. Because accuracy is cute, but the real question is:
How much money would you have made if you had invested in the stocks that stocksbrew predicted positively?
So I simulated a super simple long/short strategy using sentiment as a signal over different time windows using the 3-day rolling strategy that we discussed earlier.

what i learned (so far)
- Smoothing (3D / 5D) usually makes the system look less random because it stops overreacting to one-day news spikes.
- Filtering to “high accuracy only” can change the story a lot because it basically says: “don’t force it, only trade where this signal has historically behaved.”
This is not financial advice btw, it’s just me turning my newsletter into a mini research lab lol.
Conclusion
Overall: super fun, definitely imperfect, but it’s already taught me a lot about how noisy “news → price” is.
Some things I want to do next (yus, more chaos):
- test different sentiment prompts / compare the naive approach vs historical-context approach properly
- track performance live going forward (not just backfilled history)
- add better baselines (like “always hold”, “always long”, etc.) so I’m not cherry-picking
- eventually make it more agentic than “stateful pipeline that outputs a number”
But anyways, that's all for now and I'll see you in the next one!